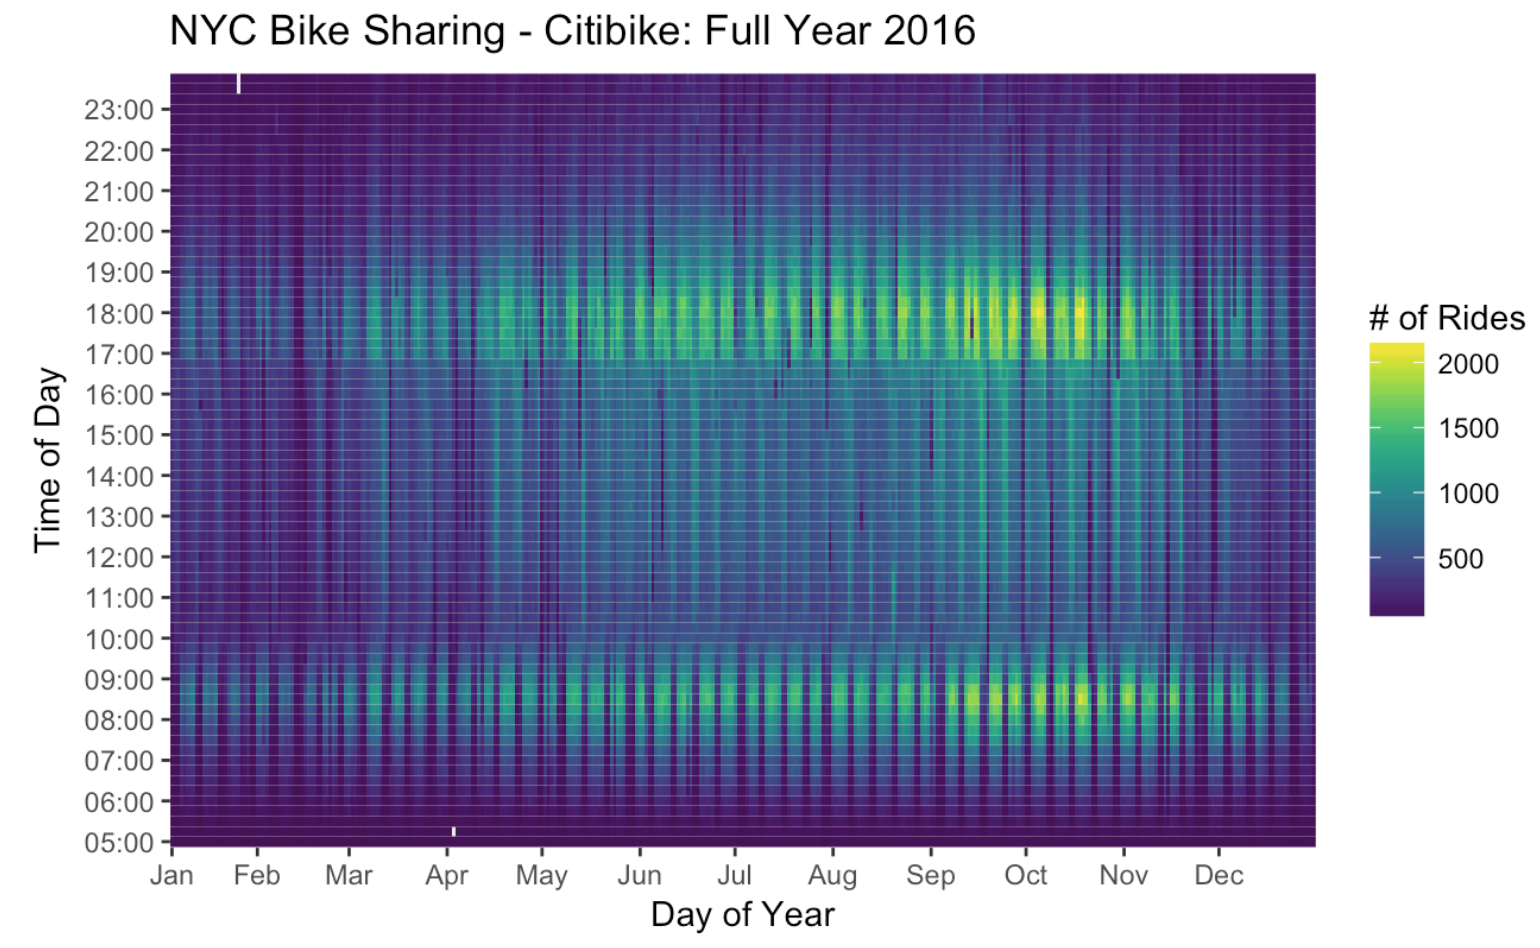
Here is a heatmap of the approx. 13.8 million Citibike rides in 2016, with each day as a column and every 15 minutes as a row.

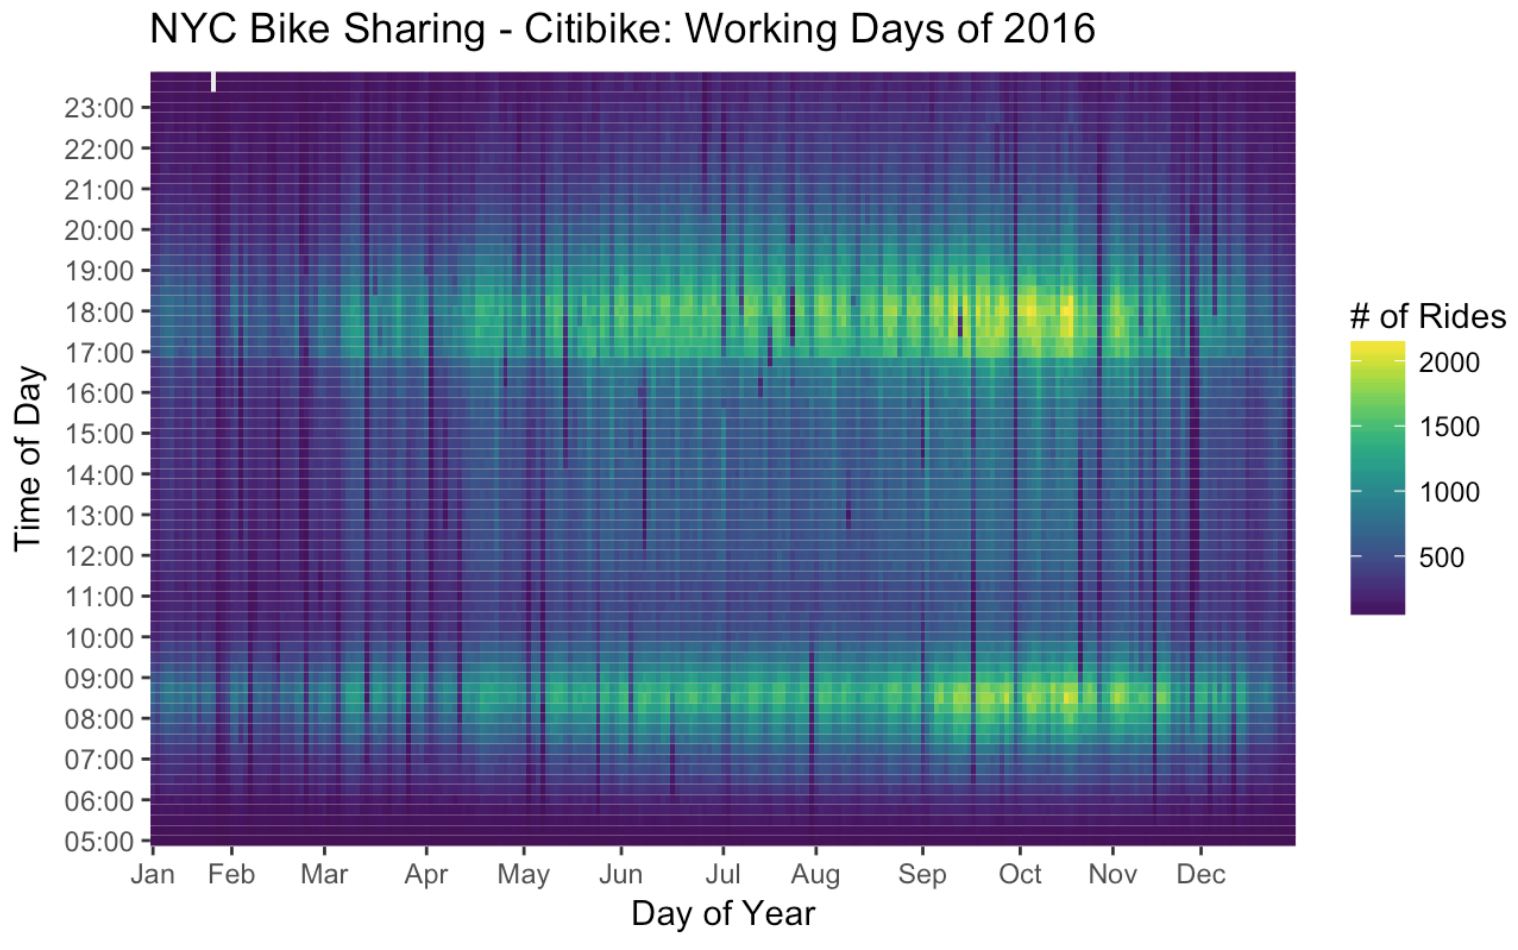
We immediately see the distinction between working days when people use citibikes to get to and from work and weekends and holidays when riding primarily occurs during the day. It is also clear that riding peaks in September and October which can be explained by the great fall weather in New York. To focus on commuting behavior, I removed all weekends and holidays.

Looking at rides on working days we see that commutes home truly start at 5pm, there is a clear distinction moving from the 4:45 - 5:00 increment to the 5:00 - 5:15 increment. Similarly, there is a drop off from the 8:45 - 9:00 increment to the 9:00 - 9:15 increment. There is also a relatively dark area between 10:45 and 11:30 which I believe captures the lull between commutes to work and the lunch rush.
I used pandas to combine the quarterly CSVs made available by Citibike, and then exported a group by function to R where I used ggplot to produce these heatmaps.