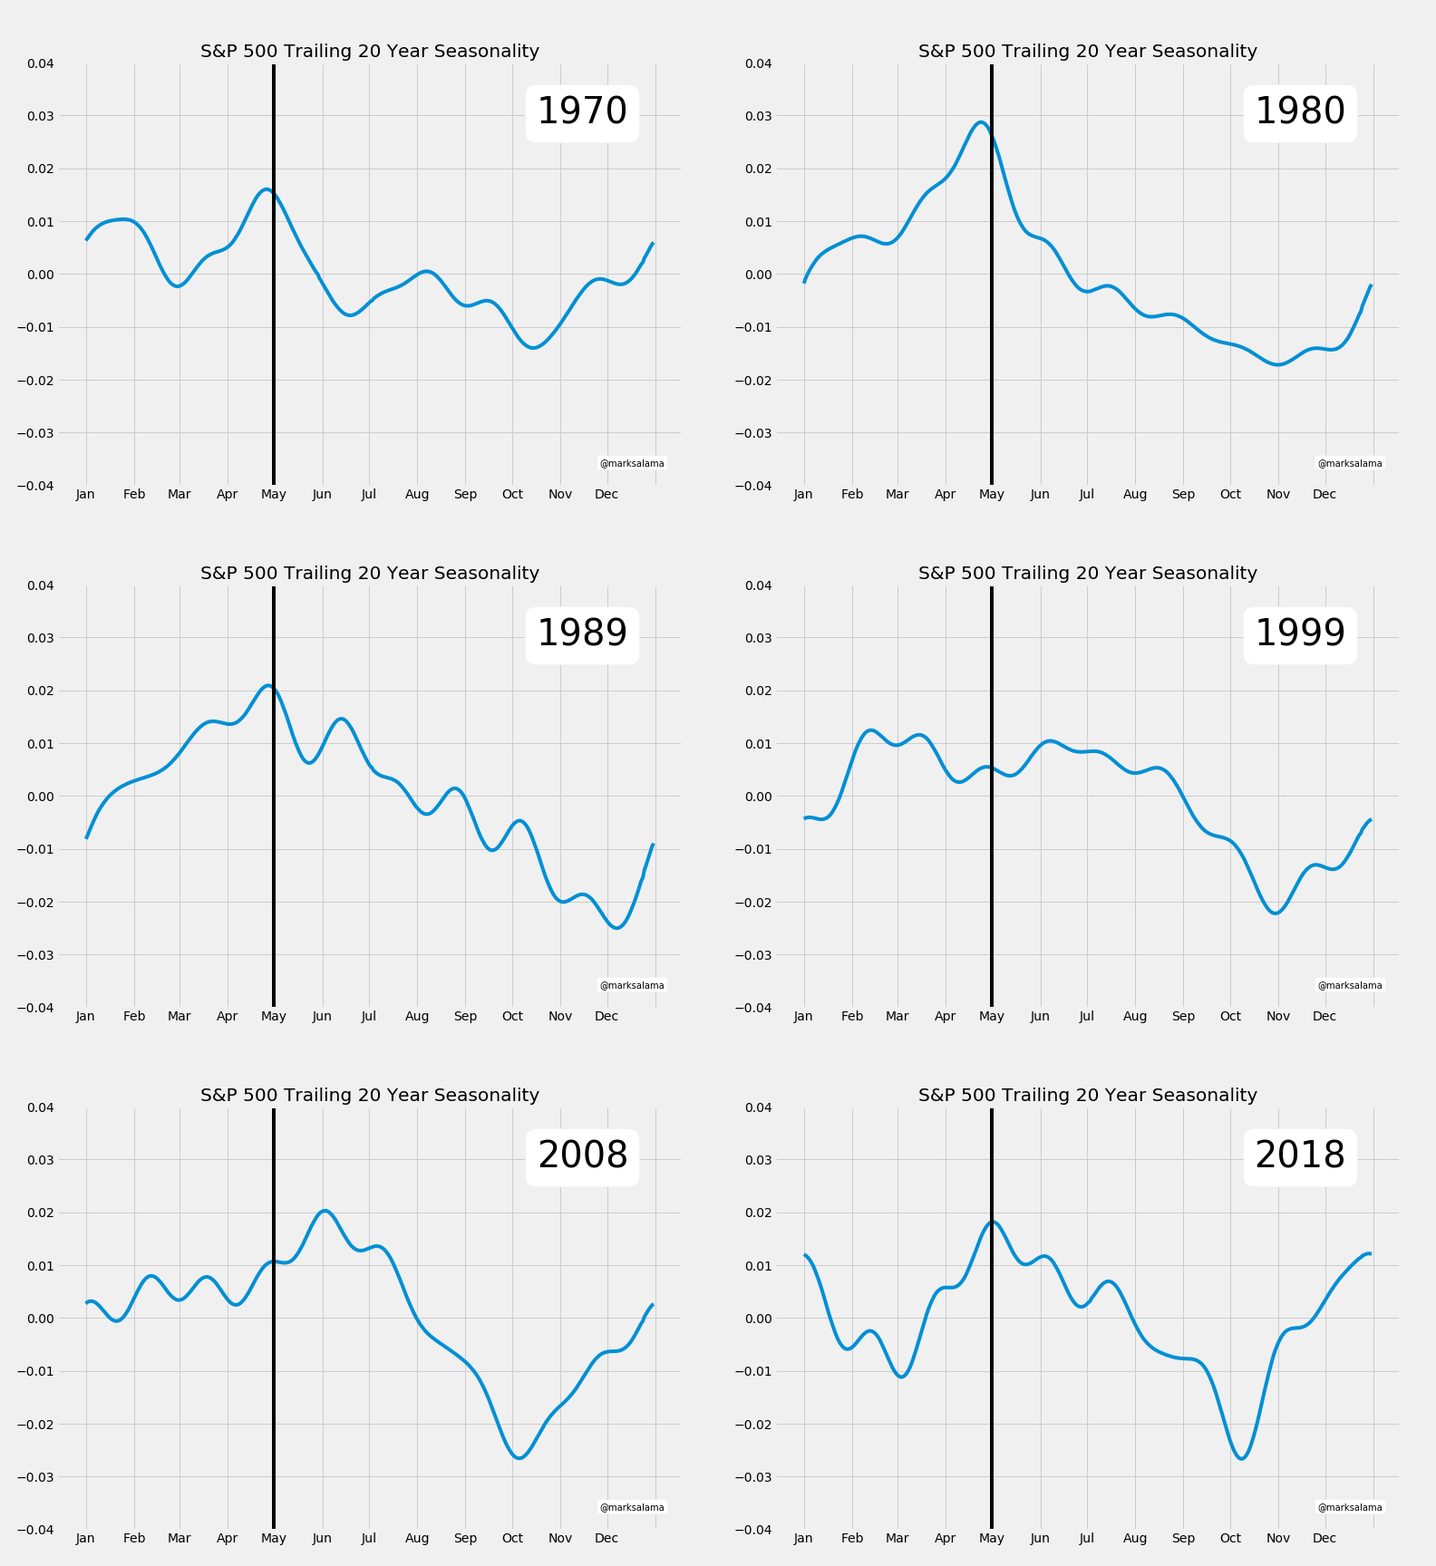
Facebook released a time series analysis package called Prophet which makes it easy to work with time series data. I loaded up S&P 500 data, and when looking at the seasonal decomposition using the plot_components method, I noticed that there was a peak around May. It explained the old saying ‘sell in may and go away’. The below gif shows the seasonal decomposition for the trailing 20 year period.
