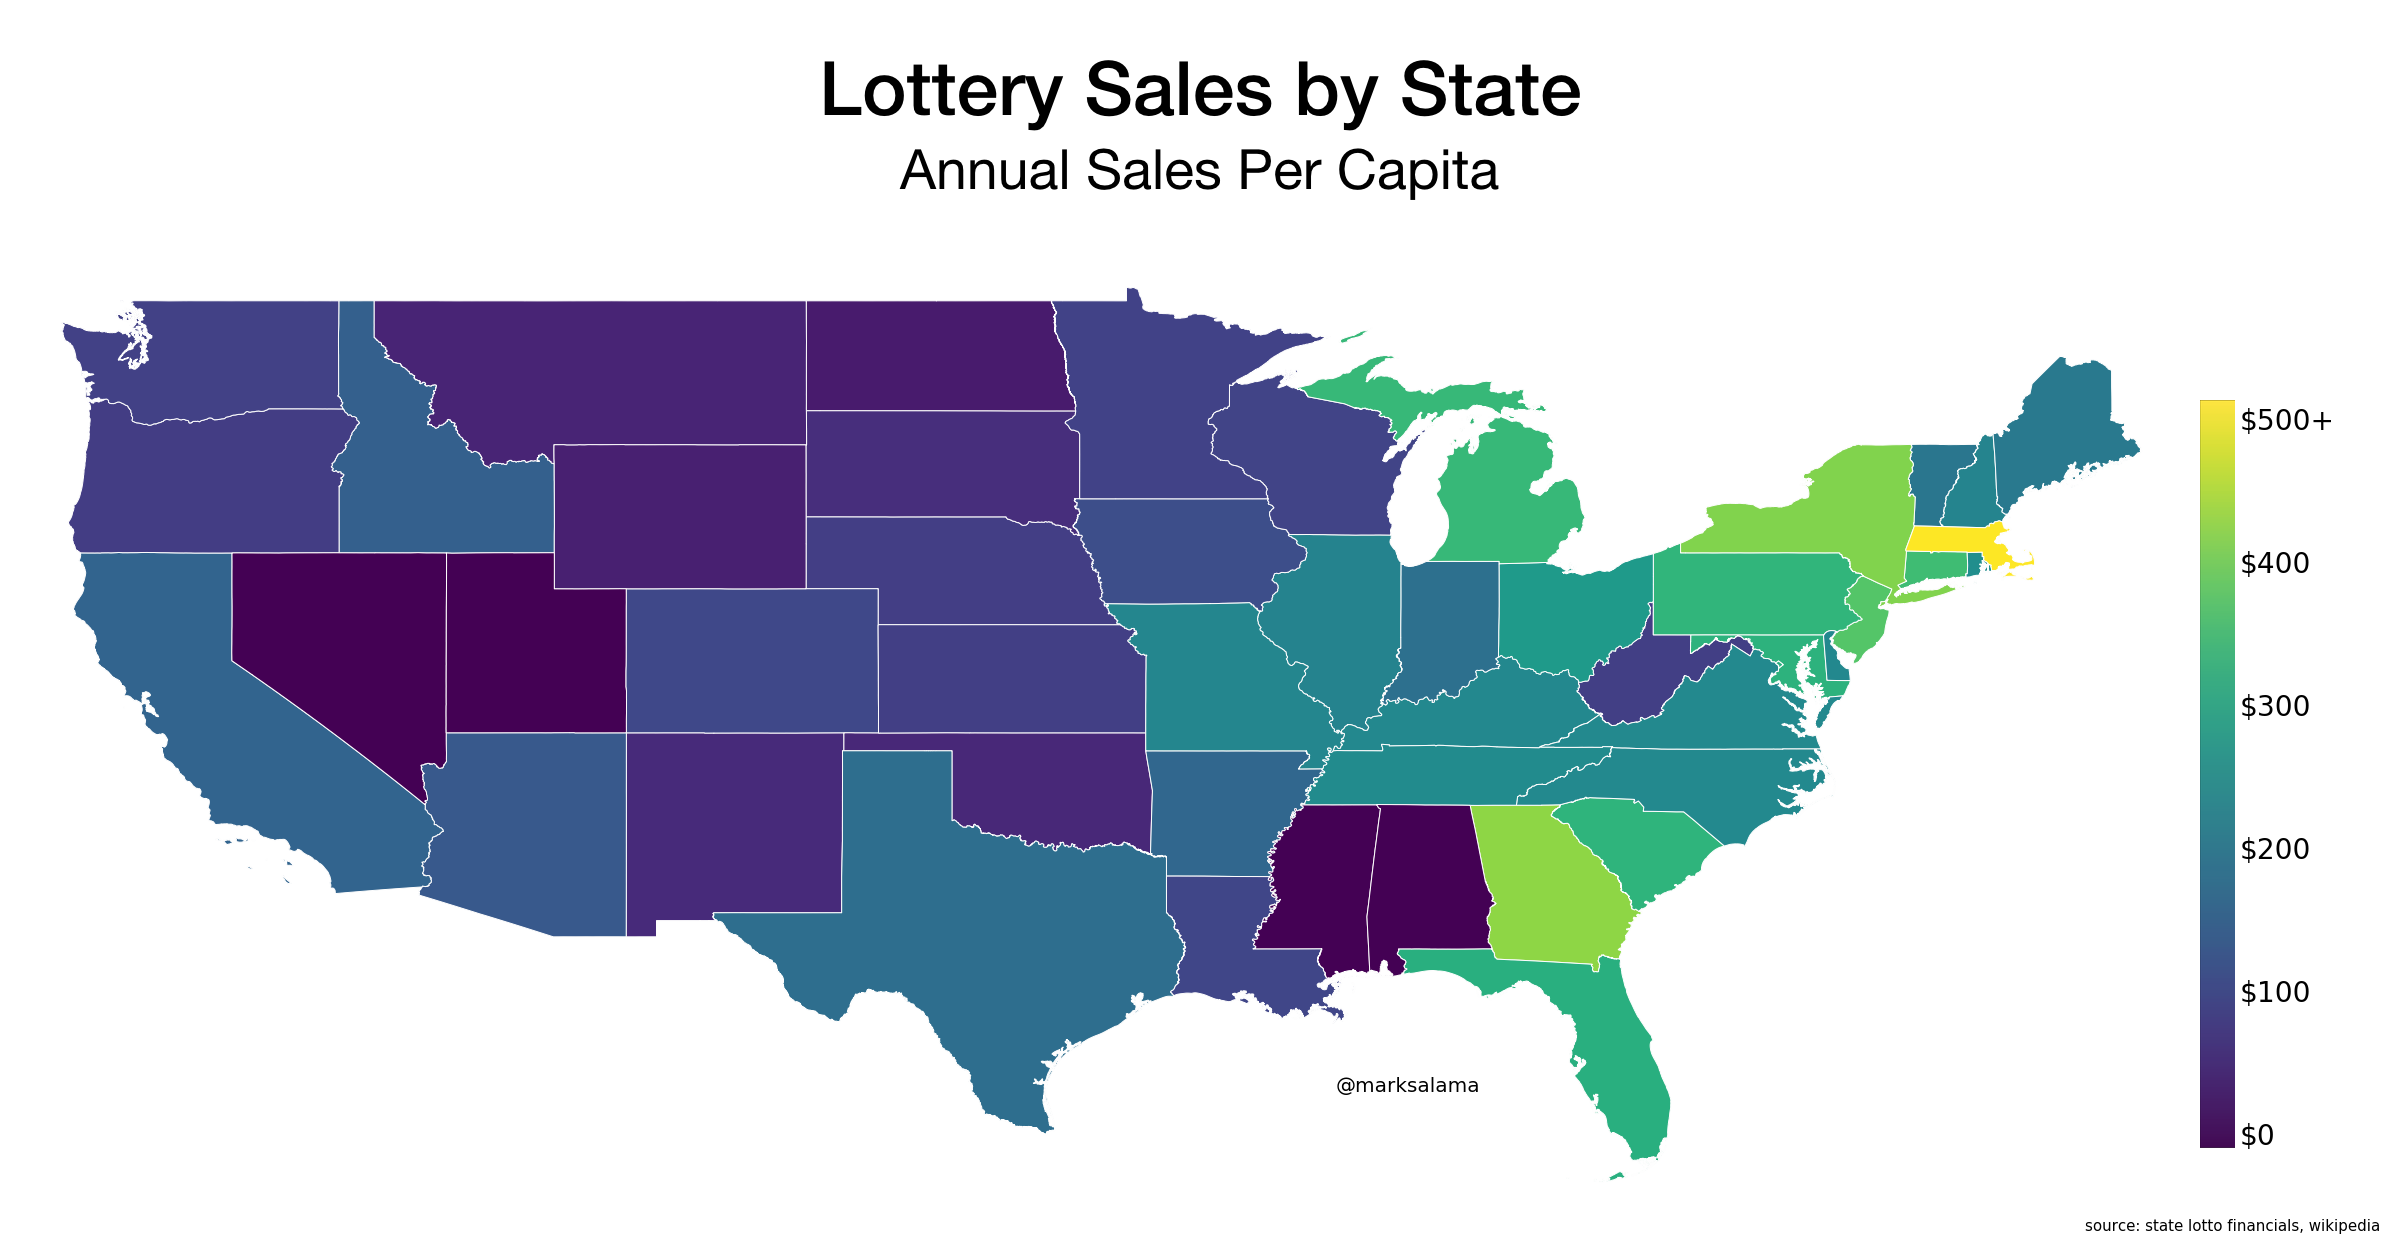
Previously I looked at sales across states for the multi-state lottery games, Mega Millions and Powerball. While the amounts were impressive, these games are generally a fraction of a state’s total lottery sales which are dominated by scratch-off instant games. Using data from each state’s lottery commission, here is a map with total lottery spending per capita.

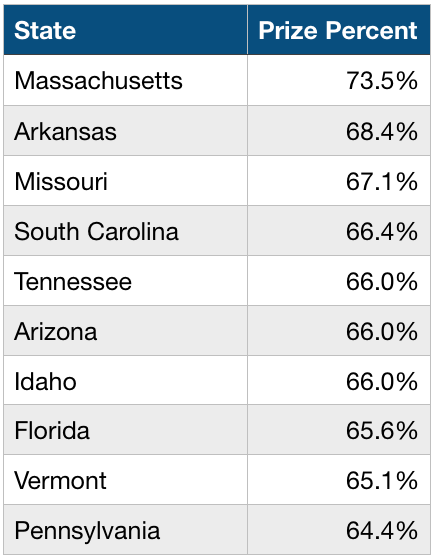
It appears that lottery is predominantly an east coast phenomena with multiple east coast states selling more than $365 per capita, or $1 a day per person in tickets. Lottery sales in Massachusetts exceed $5 billion annually, or nearly $750 in sales per person. Part of the explanation for Massachusetts’ relatively high sales may be their high payout rate.

Important to note that each state’s lottery sales are composed of different games, and games on average have different payout rates. One state may have a higher percentage of scratch-off sales, which have higher payouts. Likewise there are issues comparing total lottery sales. South Dakota appears to have low per capita sales, but if you include video gambling sales, per capita sales exceed Massachusetts. Same with Rhode Island. For consistency, I excluded all video gambling sales.