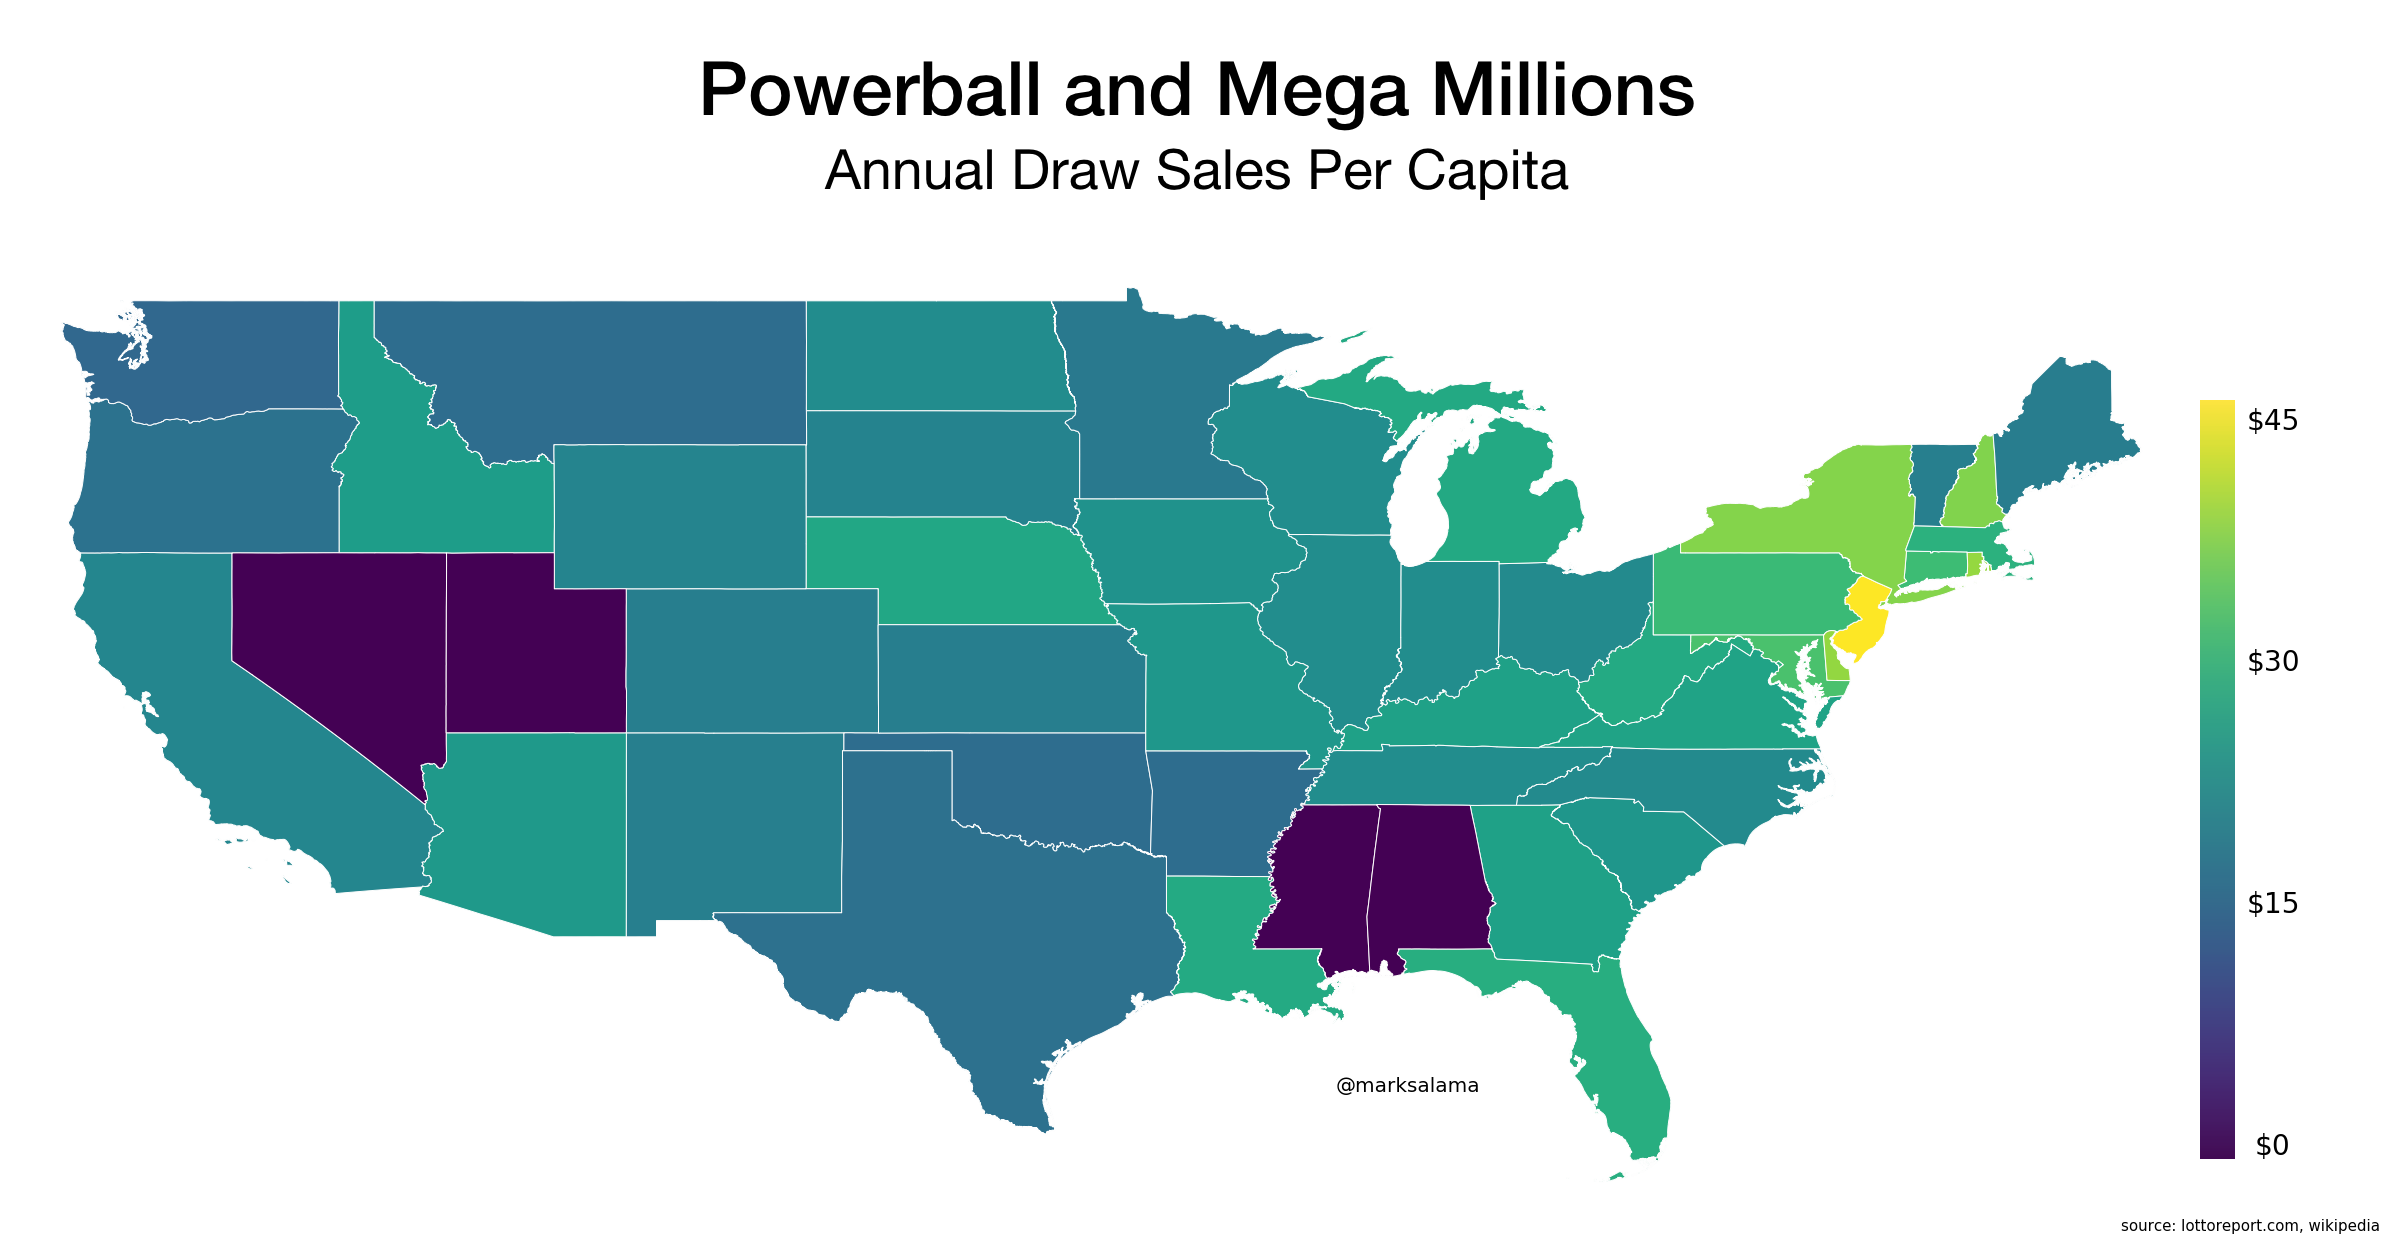
Using data from LottoReport which breaks down sales by State, I built this map showing combined sales for Powerball and Mega Millions per capita. I downloaded data from 2010 to 2018, interpolated population data from Wikipedia, and plotted the median sales per capita.

New Jersey stood out with more than $45 spent per person per year based on $400 million in annual sales for the two games across 9 million people in the state. Considering gambling is an addictive activity, we can assume sales follow a left-skewed distribution with many spending much more than the average. Regardless, $45 for everyone in New Jersey seems like a lot.
I thought Mega Millions and Powerball were the highest grossing games but I was wrong. According to the New Jersey Lottery, PICK-3 is the most popular game and nearly $3.3 billion is spent annually across all games. $3.3 billion across 9 million people is more than $300 per person. And again, not everyone plays so many are spending thousands per year. I understand that there are many beneficiaries of the lottery complex. In NJ, a minimum of 30% of ticket sales are sent to the state for education and other causes and retailers also benefit (receiving 5% of sales). But what about the people playing. We shouldn’t ignore the impact lottery has on Americans simply because schools are receiving funding. It is not in our country’s best interests to make education dependent on an addictive and potentially destructive habit.
In Phishing for Phools, Akerlof and Shiller explain that when slot machines were first introduced in the late-1800s, Americans were glued to these machines. Many lives were ruined and eventually regulations were introduced to limit slot machines to casinos. Now, with so many parties benefiting from lottery revenue, regulations are unlikely to disrupt the status-quo. The prevailing forces are pushing Americans to gamble more and more.