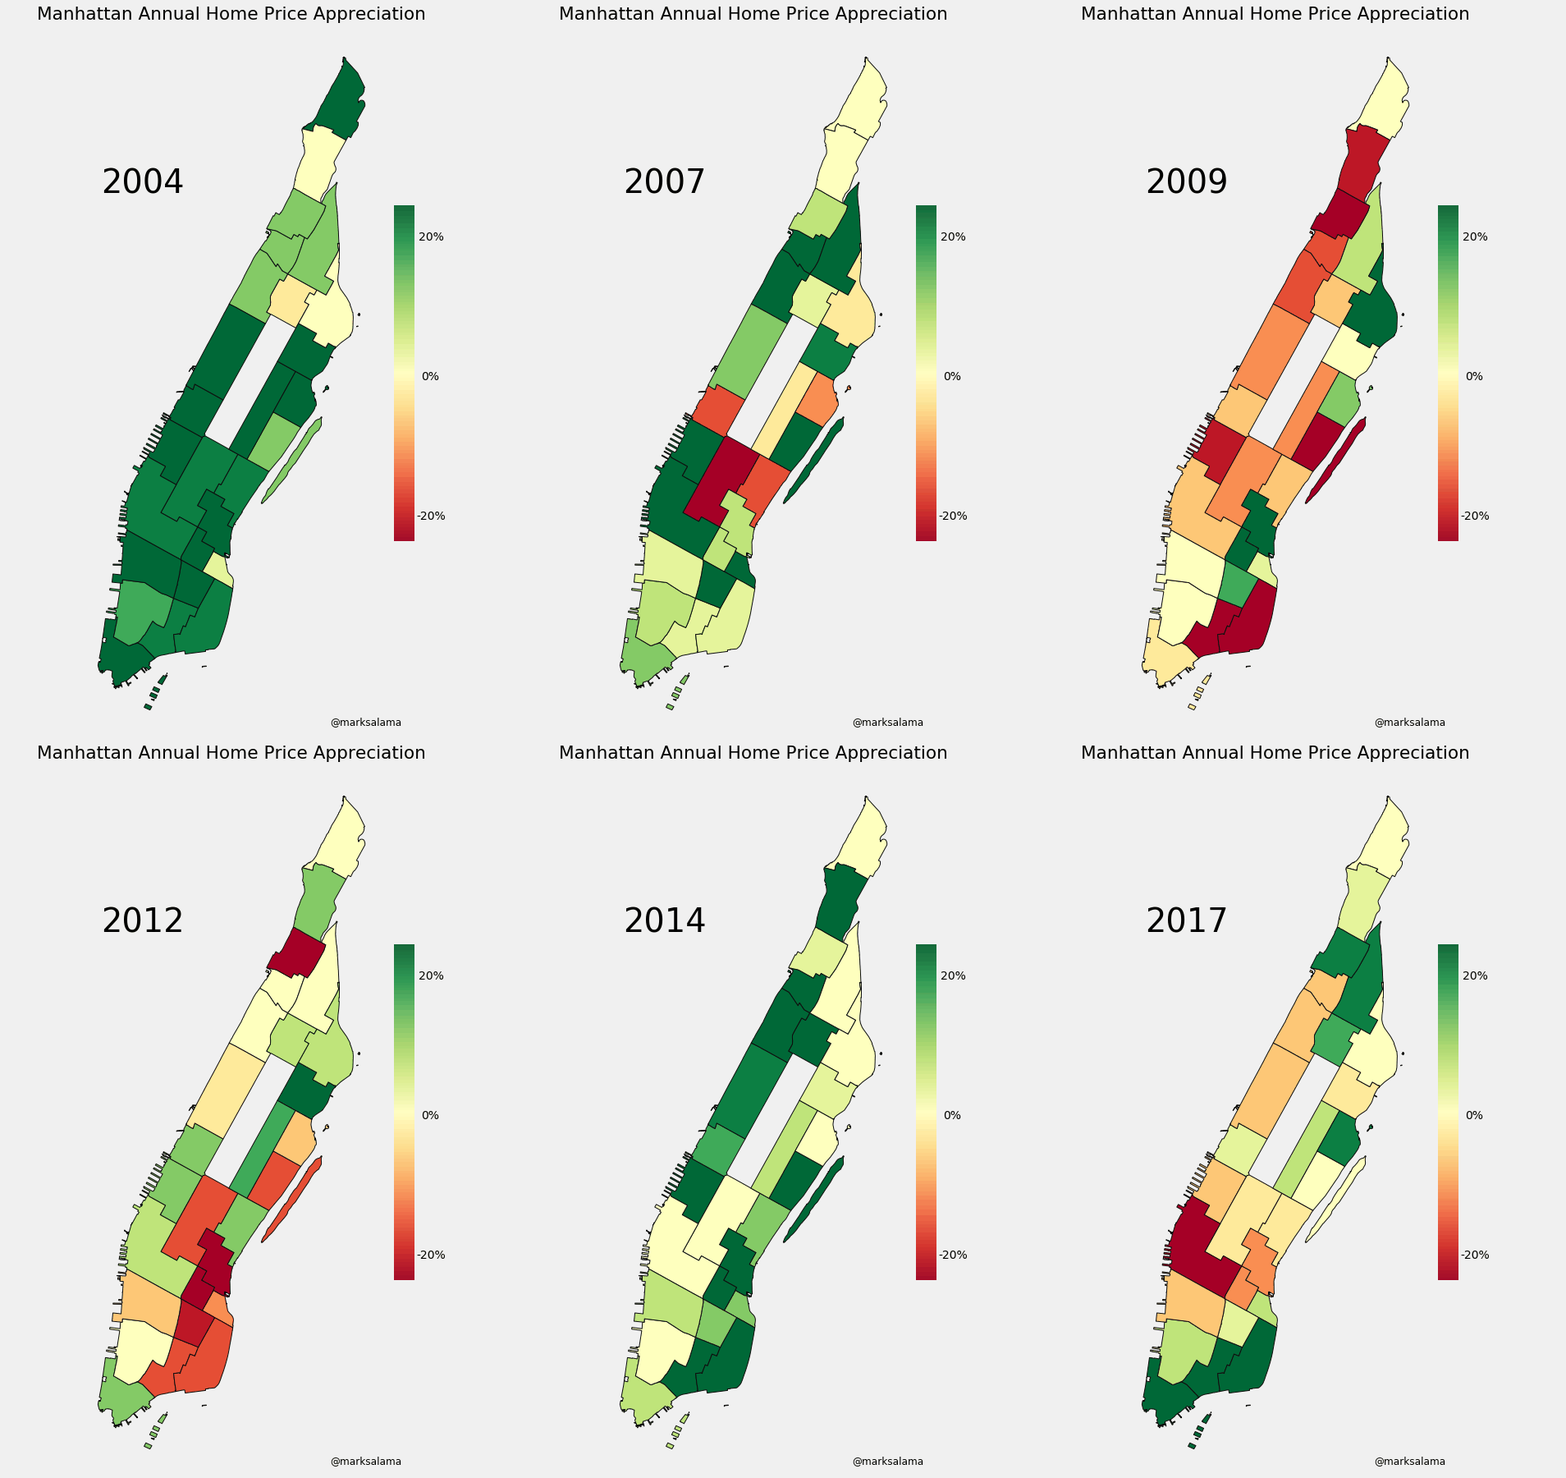
NYC makes annual home sales data available going back to 2003. They also provide geographic data that breaks NYC into neighborhoods. To better understand home appreciation by neighborhood, I combined the datasets and built this GIF.

The only tricky part was figuring out how to associate each transaction with a neighborhood. I found the latitude and longitude of all zip codes for which there was a transaction, and then used geopandas to join each zip code to a neighborhood. It would have been more accurate to find the latitude and longitude for each address but that would have required a large number of Google API calls.